New data on rising disability and mental ill-health
What the new FRS data tells us about overall trends and whether these differ for young people
I blogged last week about some of the important findings from the latest Family Resources Survey (FRS) release - one of the most important sources for figuring out what’s been going on to incomes, welfare, and work. But this week I want to focus on just one further part of this - what the FRS tells us about trends in disability.
Overall disability
We’ve seen lots of coverage of the rise in self-reported disability1 using the Labour Force Survey (LFS) data – but for reasons I’ll go into in future posts, there’s reasons to doubt the LFS data. So it’s striking to see that the FRS data also show a sharp rise in disability.
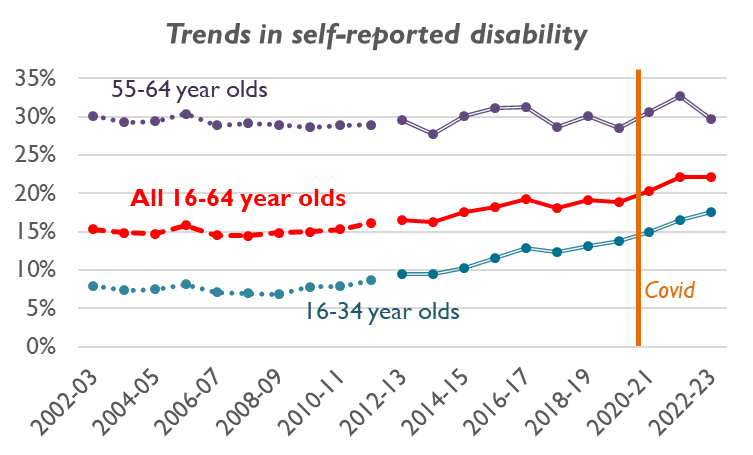
Table 4-1 of the main release shows the rise in disability among working-age adults, but because ‘working-age’ has been changing over time, I created some new tables for a consistent group of 16-64 year olds, shown below. (There’s a slight wording change in 2012/13, hence the gap in the graph at that point, but it doesn’t make much difference so I’ve ignored it below).
Put simply, this echoes the rise in disability found in the LFS – but there’s a few things to note about this:
There was a sharp rise in disability before Covid of 3.5 percentage points (from 15.3% to 18.8% 2002-3 to 2019-20). There’s then a rise as Covid starts in 2020/21, and a further rise in 2021-22, though nothing has changed in the most recent year (to 2022-23).
This rise has only happened for young people. Young people (aged 16-34) see a more than doubling in disability over this period (from 7.9% to 17.9%). Mid-aged people (aged 35-44) follow the all-age pattern pretty closely, so I haven’t shown them in the graph. And there’s basically no change in 55-64 year olds (despite the rise in women’s pension age over this period).
Mental health trends
Mental health is obviously a major factor in this2. (For these analyses I’m starting from 2012-13 because the discontinuity makes a big difference).
Among 16-35 year olds, 3.0% of young people in 2012-13 reported both a disability and their mental health being affected (‘mental health disabilities’) – this had risen to 10.7% in 2022-23. This was particularly sharp among those who didn’t report being affected in other ways3 (so their disability must be because of their mental health), rising from 1.7% to 6.3% over the period. There’s also a sharp rise in young people reporting both a mental health problem and other health issues (rising from 1.3% to 4.4%). But other health problems without mental health problems stayed pretty flat at 6-7%.
This is all a bit different for 55-64 year olds. There is a sharp rise in people saying that they’re affected by their mental health (from 3.9% to 10.4%). But overwhelmingly this rise is among people who report being affected by other health issues (3.0% to 8.0%, vs. a rise from 0.9% to 2.4% among those affected by mental health but no other health issues). And most commonly at this age you have people affected by other issues but NOT mental health (which actually fell from 25.7% to 19.4% of 55-64 year olds – basically other health issues stayed flat, but slightly more of them had mental health comorbidities).
It's worth clarifying that this is nothing at all to do with being out-of-work – rates of reporting of mental health disabilities rose proportionally more 2012-13 to 2022-23 among young workers vs. young non-workers (rising from 1.2 to 8.0% in the former, vs. 6.0 to 16.1% in the latter). And indeed the same is true at older ages, although in 55-64 year olds, mental health disabilities are consistently much more common in non-workers .
Final words
In other words – self-reported disability has gone up, particularly among young people, and particularly around mental health. But we should stress that (i) this started happening before Covid, and (ii) this doesn’t seem to be an issue of people out-of-work saying that it’s because of their mental health, because workers have seen similar rises in mental health problems.
None of this is a surprise, but it’s useful further confirmation of the wider picture. And there’s still lots we don’t know here, so I’ll be returning to interrogate this further in the coming months…
‘Disability’ here is the FRS version of the standard ‘limiting longstanding illness’ questions. In the most recent years, they ask “Do you have any physical or mental health conditions or illnesses lasting or expected to last for 12 months or more”, then “Does your condition or illness/do any of your conditions or illnesses reduce your ability to carry-out day-to-day activities?”, where people could answer Yes, a lot // Yes, a little // Not at all (questions are slightly different before 2012/13).
The FRS has a better (if still imperfect) question on impairment types than the LFS. To people that said they had a longstanding health condition/illness (see fn1), they asked “Do any of these conditions or illnesses affect you in any of the following areas?” They ask this in a number of areas, one of which is ‘Mental health’.
Note that because Stat-Xplore only allows me to include 10 fields in a table, I had to only select some of the other health problems here. In this section, ‘Other health problems’ includes Vision // Hearing // Mobility // Dexterity // Memory // Stamina or breathing or fatigue. Given that I couldn’t include everything, I decided to exclude those impairments that are partially overlapping with mental health: “Learning or understanding or concentrating” and being affected “Socially or behaviourally (for example associated with autism, attention deficit disorder or Asperger's syndrome)”. But I realise this isn’t ideal. I also excluded ‘Other’.


