
How to get disability statistics you can trust
My last post described the 'disability statistics disaster' - now I explain how to fix it

The UK’s disability statistics are a disaster, as I explained in my last post. But trustworthy statistics are within our reach, and could be used to drive a more inclusive society. In this post, I set out what better disability measures look like, and conclude with a call to Government to collect the data to underpin them – and for all of us to push them to do so.
How to measure disability across time and place
A quick recap of my last post: the official way of measuring disability in the UK is a measure of longstanding activity restrictions, which underpins things like the disability employment gap. However, this isn’t trustworthy for comparisons over time/place because rises in activity restrictions could reflect any combination of (i) rising sickness/morbidity, (ii) rising medicalisation, or (iii) rising exclusion, and we don’t know which. As a result, the conventional measure could make success could look like failure, which is the worst thing a measure can do. A different, simple measure – the prevalence-adjusted disability employment gap – can alert us to problems, but it can’t show us the true picture.
We simply need better data, with questions about disability that are interpreted in the same way across different times and places. And the best way of doing this is to ask a series of specific questions on impairments. To make this more concrete, consider a question about whether people are able to ‘raise a 2-litre bottle of water or soda from waist to eye level’. People’s answers to this question are unlikely to be affected by the nature of paid work or the benefits system in their country. In contrast, policies and work environments may well affect whether someone reports an activity-limiting disability, which is why the conventional measure is not trustworthy for tracking inclusion over time. So what we need is a set of questions that ask about every type of potentially activity-limiting impairments, and then we can build a scale we can trust.
The devil in the detail
While this sounds easy on paper, there’s a raft of further things that we have to do if we’re going to use this approach.
Firstly, we have to clarify what ‘disability’ means. There’s actually two different ways that disability experts/activists use the word ‘disability’: one to mean people who are potentially disadvantaged in the sorts of contexts we see in twenty-first century Britain, and one to mean people who are actually disadvantaged in their particular context.1 The approach that I’m advocating is to measure potential disadvantage, because this is the only way we can track the impacts of policy – i.e. to investigate inclusion from a social model perspective, we need to look at whether potentially disadvantaged people are actually disadvantaged or not. But we need to be clear about what we mean here.
Secondly, we need to accept that specific impairment measures are going to be more trustworthy, but they’re not perfect. We might think that asking people if they can dress themselves is specific, but as Daniel Mont has put it, “‘dressing oneself’ can take on very different connotations in a society where one ordinarily slips into pants and a loose fitting shirt, compared to dressing in something as complicated as a sari.” It’s particularly tricky to get consistently-interpreted measures of mental distress, pain and energy-related impairments, where we need to use symptom-based measures. But while imperfect, this is good enough for most purposes: if we use well-validated scales for these things, and appropriate statistical methods (see below), the resulting analysis will be pretty trustworthy – and definitely much more trustworthy than the measures we’re currently using.
Third, there’s a bunch of further decisions to do these analyses, and unfortunately people strongly disagree about some of them. The UN Washington Group on Disability Statistics has recommended one approach, but the WHO has recommended a different approach, and other researchers disagree with both. In our OECD working paper, we explain what different people think, what’s at stake, and what we think is best, covering:
Which disability questions to use;
How to put these different disability measures into a single scale (we advocate doing this based on how strongly the measures predict disability);
How to turn this scale into a ‘disability’ categorical measure (we propose a new approach that does this probabilistically), and whether we should look at disability as a continuum.
But despite the sometimes fierce disagreements, these are really second-order questions – if you’ve got better data on multiple specific impairments underpinning all of this, then you’re likely to have a more trustworthy measure than we currently have.
What happens if we use this approach?
The biggest problem is that this data simply doesn’t exist – either to look at trends in the UK, or to compare the UK to other countries. But we can make a tentative attempt to look across countries for 50-69 year olds, comparing the English Longitudinal Study of Ageing to comparable surveys in the USA and Europe. Note: this isn’t perfect, partly because they don’t cover all of the impairments/symptoms we’d want, but I’m always asked what the most robust picture we currently have is, so it makes sense to include it here:
Disability employment and the disability employment gap among 50-69 year olds, across countries using our recommended measure
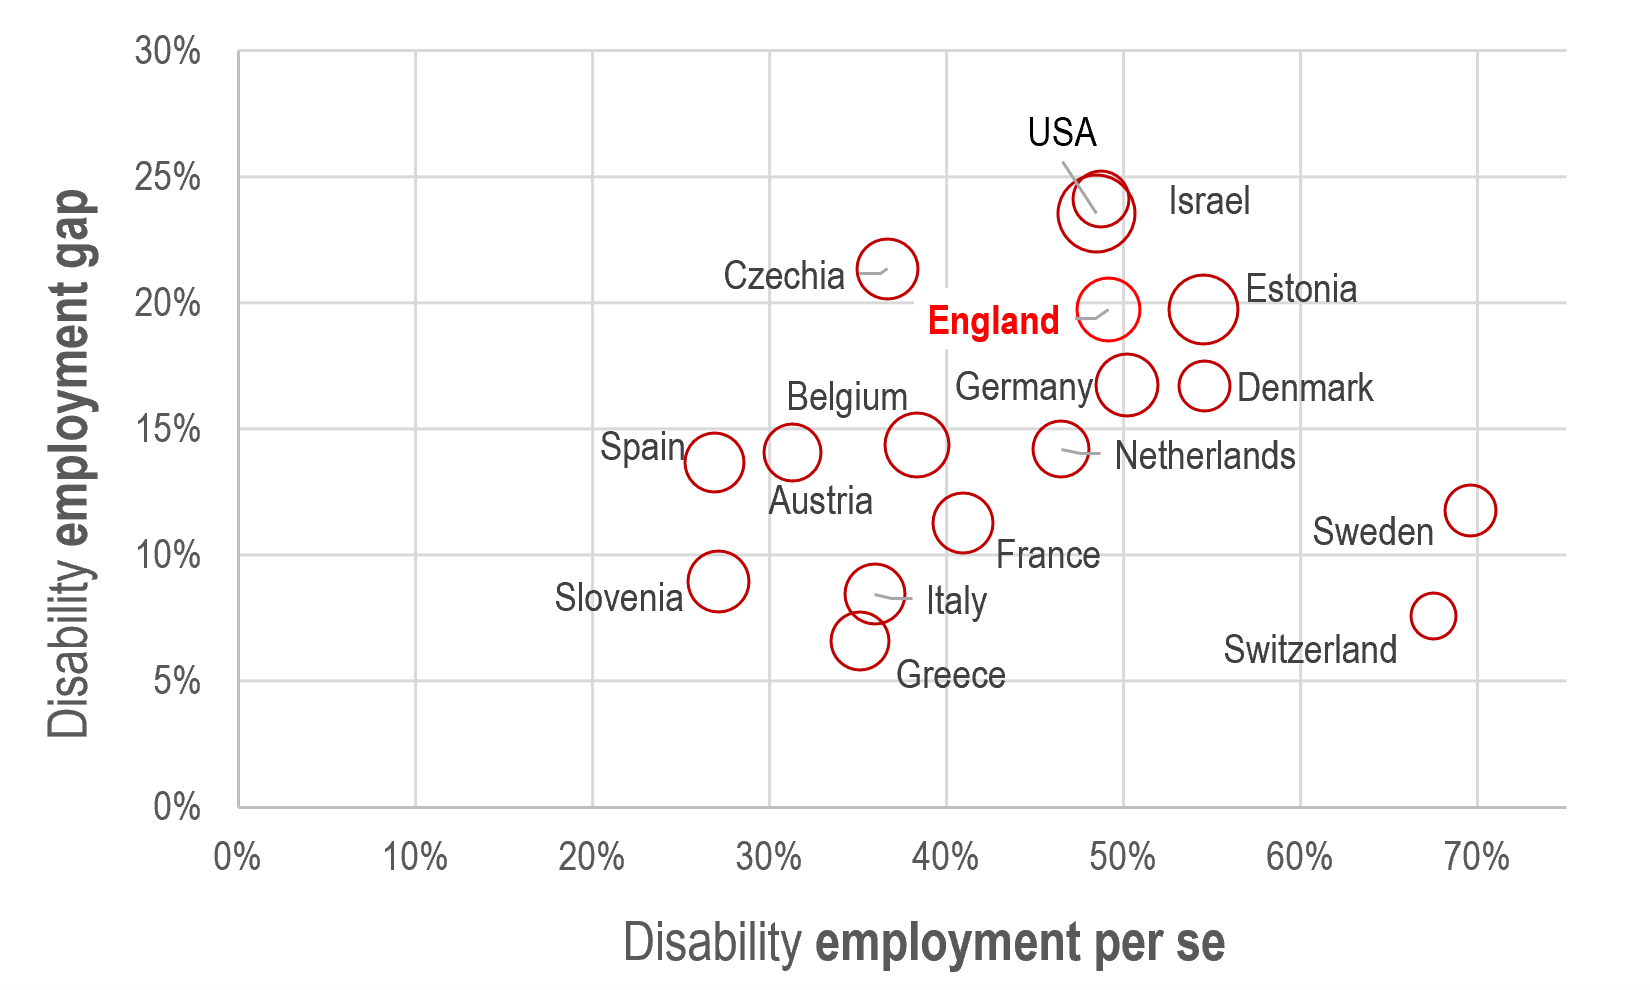
Redrawn version of Geiger & Prinz (2025) Figure 4.1 using ELSA/SHARE/HRS data – see the report for full detail
This shows the disability employment rate on one axis, and the disability employment gap on the other. The reason for showing the data in this way is that you can see that some countries (e.g. Italy, Greece, Slovenia) have a really low disability employment gap, but that’s partly because the employment rate of 50-69 year olds is so low in these countries. (More generally there’s a relationship between these two measures, so that countries with higher employment rates seem to have higher disability employment gaps).
In contrast, Sweden and Switzerland stand out for having very low disability employment gaps, and very high disability employment rates. To reemphasise: this is a tentative analysis of 50-69 year olds, and we need more robust data, to look at a wider age group, and to look at a wider range of countries. I’m not betting my house that Sweden and Switzerland are genuinely the countries that do the best job of including disabled people in the labour market. But while we’re waiting for better data, it’s worth looking more closely at both countries to see if there are any useful lessons for the rest of us.
How to collect better data in the UK
To be clear – I’m not suggesting that we should get rid of the existing disability measure completely. If you want to ask all of these specific impairment/symptom questions, then you need a lot of space in a survey, and it’s unrealistic to suggest including this in all major Government surveys. So the existing measure still has a use in providing rapid evidence, and showing a detailed picture of inequalities.
But if we really want to see what’s happened to disability inclusion in the UK, we also need to periodically do a ‘calibration survey’ – that is, a survey that tells us whether the more regularly-collected simple measure is trustworthy. There’s two different ways we could do this in the UK:
1. A module on the national health surveys: the Health Survey for England (HSE) was almost scrapped recently (as I blogged about), and while it appears to be temporarily saved, it’s medium-term future is hazy. So this is an ideal moment to try to advocate for putting these questions on HSE every 2-4 years. It’s also an ideal place to put them: it’s a relatively large, high-quality survey on health that has rotating modules; and it would be useful to place the impairment questions alongside the regular HSE questions.2
2. A new, periodic disability survey: the other alternative is to create a new disability survey, possibly done as a follow-up to the Family Resources Survey (which is how the 1995/6 disability survey was done). This would probably be more expensive and take more organisation, and there’s real capacity issues around survey interviewers at the moment, but it might be worth it if either DHSC refuses to cooperate on HSE, or if the requirements differ (e.g. if we want a larger survey to look in detail at different impairment groups, or to get over-representation of disabled vs. non-disabled people). The most important thing here is to learn the lessons of the Life Opportunities Survey (LOS), the most recent expensive disability survey that was launched with much fanfare in 2009 but cancelled in 2013.
If you’re reading this blog post, then you may well be the sort of person that could help push DWP/DHSC/others to create better data. While there are many more important things to fight for at the moment, this is one of the rare occasions where pushing for better data is also important – so please do what you can, and do let me know if you can help push for this to be included on HSE.
The door seems to be opening here, so if we all work together, this might actually happen, and we might get some statistics we can trust…
For example: some disability activists who are socioeconomically advantaged wheelchair users would describe themselves as ‘disabled’, even if their particular context means that their activities are not restricted – because clearly they are potentially disadvantaged in the UK, and will sometimes have to deal with ableist treatment and non-inclusive environments, even if these don’t limit their usual activities. Indeed, Jenny Morris said as much in a comment on the last post.
To get Great Britain-wide figures, this could be done alongside similar modules in the Scottish and Welsh Health Surveys
Interesting post Ben, and lots to think about. The challenge with going down the health survey route for a disability survey of GB is that there isn't a Welsh Health Survey (WHS). The National Survey for Wales incorporated key measures from the WHS when it was established in 2016. Doing a disability survey off the back of something like the FRS risks context effects with how disability is asked about on that survey alongside other topics, such as welfare benefits. An alternative approach could be to run the questions on a random probability panel survey, which would be cheaper than a stand alone survey, but there are some draw backs to this.